#kubernetes selector node
Explore tagged Tumblr posts
Visit Tumblr Blog
Explore Tumblr blogs with no restrictions, modern design and the best experience.
Last Seen Tumblr Blogs


Fun Fact
The most popular pages on Tumblr are about Minecraft, GIFs, and David J. Peterson.
Text
How to Test Traffic Using a Custom Kubernetes Controller: A Step-by-Step Guide

K8s controllers and operators
In k8s world every resource created via controller. Like there are inbuilt controllers for pods, deployments , replica set etc. So basically, Controllers are nothing but a control loop that continuously monitor the state of the cluster and take actions to bring the cluster into the desired state. The resources have a spec that provides the desired state. The controller checks the current states. If it doesn’t match the desired state, it will make the appropriate changes or modifications to bring it closer to the desired state.
Different types of Kube-Controller-Manager
ReplicaSet Controller: This controller is responsible for maintaining a stable set of replica Pods running at any given time. It is often used in conjunction with Deployments to ensure that a specified number of pod replicas are running at all times, even in the event of node failure or pod termination.
Deployment Controller: This controller provides declarative updates for Pods and ReplicaSets. It allows for easy scaling, rolling updates, and rollbacks of applications. The Deployment controller manages the creation and deletion of ReplicaSets to ensure the desired number of pods are always running.
StatefulSet Controller: This controller is used for managing stateful applications, such as databases. It provides unique identity (a stable hostname) to each pod in the set and maintains the order and uniqueness of these pods. It's particularly useful when you need stable network identifiers, stable persistent storage, and ordered, graceful deployment and scaling.
Service Controller: This controller is responsible for maintaining a stable IP address and DNS name for a set of pods. It acts as a load balancer and routes traffic to the appropriate pods based on the service's selector. This ensures that services have a stable endpoint for accessing the running pods, even as they are created, destroyed, or moved around the cluster.
Behaviour and Architecture
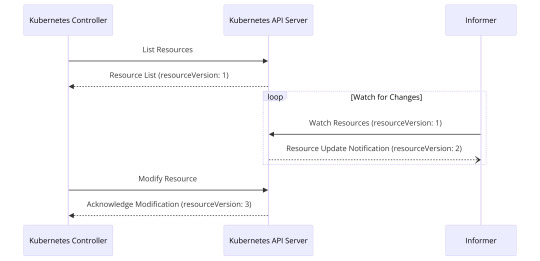
So Before diving into testing, we have to understand the basic architecture of a standard controller. In the client-server architecture of Kubernetes, controllers play a crucial role as clients that make API calls, primarily HTTP, to the Kubernetes API server. Their main objective is to reconcile Kubernetes API objects with the actual system resources. An essential component in this architecture is the use of Informers. Informers are responsible for monitoring any changes in the cluster, which is crucial because continuous polling to retrieve information on resources can significantly degrade the performance of the API server.
Informers work by querying the resource data and storing it in a local cache. Once the data is stored, an event is generated only when there is a change in the state of an object (or resource). This approach ensures that the system is not overwhelmed by unnecessary events and that the controller is only notified when a relevant change occurs.
Custom CRDs and Controllers in Kubernetes
Kubernetes allows for the creation of Custom Resource Definitions (CRDs), which are extensions of the Kubernetes API that enable users to define custom resources. These custom resources are not available in a default Kubernetes installation and are used to accommodate domain-specific use cases and complex application requirements.
To manage these custom resources, a custom controller is required. The custom controller, CRD, and Kubernetes API server form a cohesive relationship where:
The CRD defines the custom resources.
The API server manages the lifecycle of these resources.
The custom controller ensures that the state of these resources is maintained according to the desired configuration.
This architecture enables the extensibility of Kubernetes, allowing users to tailor the platform to their specific needs.
Testing of a controller -
Ensuring that a Kubernetes controller is ready to serve requests to the Kubernetes API server is crucial before deploying it to production. There are several approaches to testing Kubernetes controllers. Some of them I mentioned are from the article :
Using client-go fakes or higher-level abstractions: This approach avoids running any backing API, making it suitable for unit testing individual components in isolation.
Using the envtest package from controller-runtime: This package works with a pared-down API server to validate real interactions with the API, including timing and cache syncs, without interference from other controllers. It supports both local testing against a pared-down instance and testing against a fully functional cluster.
Running a real API server: This approach is suitable for staging environments or instances like ephemeral kind or microk8s for testing real outcomes. It allows for testing interactions against a real API server.
The advantage of using an external process, such as envtest or a real API server, is that it accounts for the latency inherent in a distributed system. Libraries like Gomega can be used to wait for specific conditions after an action occurs.The above approaches are more often sounds best for unit testing and integration level testing, where we are testing a particular component in isolation. either by faking out the data by writing tests
While the above techniques are effective for unit and integration testing, they may not cover end-to-end (e2e) testing, which is crucial for ensuring the overall functionality of the controller. One approach to e2e testing is to perform resource updates and other operations to test the entire flow of the controller in a controlled environment, replicating the process whenever necessary. This helps validate the controller's behaviour in real-world scenarios and ensures that it is ready for production deployment.
In summary, a combination of unit, integration, and end-to-end testing is essential for ensuring the reliability and effectiveness of Kubernetes controllers before pushing them into production.
Why test kubernetes controllers with Keploy?
Building and testing Kubernetes controllers locally can be challenging, especially when dealing with outgoing API calls. However, Keploy, as a tool creates test cases and data mocks from API calls, DB queries, etc., offers a solution. Keploy allows you to record and replay outgoing calls made by your Kubernetes controller, which can be incredibly useful for testing and ensuring that your controller behaves as expected.
You might be wondering how this is possible without any code changes. Keploy uses eBPF to add probes to the kernel space and collect network buffer data. This data is then sent to Keploy's proxy, which acts as a userspace where all the processing of the buffer is done by different protocol parsers. Keploy can capture the egress traffic of the controller and store the request and response in a YAML file for that particular event. During replay mode, instead of making the API call to the real API server, Keploy will return the response from the stored YAML file for that particular request. This makes the process independent of the cluster or environment, offering a convenient and efficient way to test Kubernetes controllers locally.
Recording Outgoing Calls
So for capturing the tests of your controllers locally or from any live environment you have to first start the kubernetes cluster and make your custom controller to make some interaction with the server.
To record your controller with Keploy, follow these steps:
Set your Kubernetes *rest.Config object to be insecure and without a CA file:cfg.Insecure = true cfg.CAFile = ""
Create a custom RoundTripper to add a header field containing the resource version. This header serves as a trace-id for matching requests during the same state with recorded mocks. Here's an example implementation:type customRoundTripper struct { rt http.RoundTripper } func (crt *customRoundTripper) RoundTrip(req *http.Request) (*http.Response, error) { ctx := req.Context() rsv := ctx.Value("ResourceVersion") if rsv != nil { req.Header.Add("keploy-header", rsv.(string)) } return crt.rt.RoundTrip(req) } cfg.WrapTransport = func(rt http.RoundTripper) http.RoundTripper { return &customRoundTripper{rt: rt} }
Ensure to set the resource version value in context.Context during the sync process. This is crucial for passing the modified context to the update and create methods of your controller. For example:func (c *Controller) syncHandler(ctx context.Context, key string) error { // set ResourceVersion in ctx rv := foo.GetResourceVersion() if rv != "" { ctx = context.WithValue(ctx, "ResourceVersion", rv) } }
Build the Go binary of your Kubernetes controller:go build -o sample-controller .
To record the outgoing calls via Keploy, wrap your controller command with Keploy's record command. Note - This feature of keploy is in beta use and not yet released in main. This was specifically created as an experiment for the Kubernetes enthusiasts to try and give reviews upon. So you have to checkout in this specific branch and build the keploy binary using go build command. https://github.com/keploy/keploy/pull/1342.
Checkout in the specified branch.
git checkout kube-controller
Building the keploy binary for that branch.go build -o keploy && sudo mv keploy /usr/local/bin
Add the necessary flags according to your kube config:sudo -E env PATH=$PATH keploy record -c "./sample-controller -kubeconfig=$HOME/.kube/config" --mtls-cert-path "$HOME/.minikube/profiles/minikube/client.crt" --mtls-key-path "$HOME/.minikube/profiles/minikube/client.key" --mtls-host-name 192.168.49.2:8443
You can see keploy/test-set-0/mocks.yaml created as soon as Keploy starts intercepting the outbound calls. Each resource version has a separate mock file denoted with mocks_ + "<resource_version>".
Note - One thing which I want to clear is that, above feature doesn't help you in TDD (Test driven development). But you can still keploy while writing unit tests by leveraging the stub generation capability of keploy. So instead of making any mock api server or writing stub for a particular unit test, you can once play that test in your real environment . Keploy will store all the interactions in mock file and will use that data when next time the tests are run.
Testing with Recorded Mocks
To test your controller with recorded mocks:
Run Keploy in test mode with the mockAssert flag set to true and provide your controller binary. Keploy will automatically create a fake kube config for you:sudo -E env PATH=$PATH keploy test -c "<go-binary-of-controller-app>" --mockAssert true
Optionally, you can set your own replay time, which will try to replay your recorded session within the provided time: complete sample app integrated with keploy is given here.keploy test -c <go-binary-of-controller-app> --mockAssert true --replaySession 100
Note that the replaying process trims the large enough event time gap to a precise average duration between the two events of the informers. This allows events to be sent earlier than they occurred in the record, facilitating a faster replay.
This can help you replay the whole session of api calls produced by the controller but this time you don't need real k8s server or any external source to get the response. All the responses will be returned by the keploy itself acting like a mock server or a middleman. This can give a confidence to run it in your CI-CD pipelines.
For eg - You work in a large cloud computing organisation and to get all things deployed it requires lot of virtualization and is resource intensive operation. So its nearly impossible to test it in a real environment. Here Keploy like tool can be very useful as it has already the response which you want to get in case of a successful rollout of that resource. So it can be fast, reliable and cost saving operation as you just have capture the right flow of your controller service only one time. And can re-use the keploy replay in your subsequent releases.
Conclusion
Testing Kubernetes controllers locally can be made more efficient and reliable with tools like Keploy. By recording and replaying outgoing calls, you can ensure that your controller behaves correctly in various scenarios, improving the overall quality of your Kubernetes applications. Since keploy have native support of testing frameworks like gotest , its also possible to get the line coverage of any application even of your kube controller. Explore Keploy and enhance your Kubernetes controller testing workflow!
FAQs
What are the advantages of using Keploy for testing Kubernetes controllers?
Keploy simplifies testing Kubernetes controllers by:
Recording and replaying outgoing API calls: This eliminates the need for live environments during testing.
Improved efficiency: By using stored mocks, testing becomes faster and independent of the actual Kubernetes cluster.
Cost and resource savings: It reduces dependency on resource-intensive environments for validation, making it ideal for CI/CD pipelines in large-scale operations.
How does Keploy handle outgoing API calls for Kubernetes controllers?
Keploy uses eBPF probes to intercept outgoing calls and stores request-response pairs in mock files. During replay mode:
Calls are intercepted and matched with previously recorded mocks.
Responses are returned from these mocks instead of reaching out to the actual API server. This mechanism ensures tests can run without needing a live Kubernetes cluster.
Can Keploy be used for Test-Driven Development (TDD) with Kubernetes controllers?
While the recording and replay feature of Keploy is not designed specifically for TDD, it can still be used effectively:
Stub generation: Run the controller in a real environment once to capture interactions. Keploy will create mocks for subsequent use.
Unit testing support: By leveraging these mocks, you can avoid writing stubs manually and focus on test execution. Keploy complements existing TDD workflows by streamlining mock creation and reducing development overhead.
0 notes
Text
VPC Flow Analyzer: Your Key to Network Traffic Intelligence

Overview of the Flow Analyzer
Without writing intricate SQL queries to analyze VPC Flow Logs, you can quickly and effectively comprehend your VPC traffic flows with Flow Analyzer. With a 5-tuple granularity (source IP, destination IP, source port, destination port, and protocol), Flow Analyzer enables you to conduct opinionated network traffic analysis.
Flow Analyzer, created with Log Analytics and driven by BigQuery, allows you to examine your virtual machine instances’ inbound and outgoing traffic in great detail. It enables you to keep an eye on, troubleshoot, and optimize your networking configuration for improved security and performance, which helps to guarantee compliance and reduce expenses.
Data from VPC Flow Logs that are kept in a log bucket (record format) are examined by Flow Analyzer. You must choose a project with a log bucket containing VPC Flow Logs in order to use Flow Analyzer. Network monitoring, forensics, real-time security analysis, and cost optimization are all possible with VPC Flow Logs.
The fields contained in VPC Flow Logs are subjected to searches by Flow Analyzer.
The following tasks can be completed with Flow Analyzer:
Create and execute a basic VPC Flow Logs query.
Create a SQL filter for the VPC Flow Logs query (using a WHERE statement).
Sort the query results based on aggregate packets and total traffic, then arrange the results using the chosen attributes.
Examine the traffic at specific intervals.
See a graphical representation of the top five traffic flows over time in relation to the overall traffic.
See a tabular representation of the resources with the most traffic combined over the chosen period.
View the query results to see the specifics of the traffic between a given source and destination pair.
Utilizing the remaining fields in the VPC Flow Logs, drill down the query results.
How it operates
A sample of network flows sent from and received by VPC resources, including Google Kubernetes Engine nodes and virtual machine instances, are recorded in VPC Flow Logs.
The flow logs can be exported to any location supported by Logging export and examined in Cloud Logging. Log analytics can be used to perform queries that examine log data, and the results of those queries can subsequently be shown as tables and charts.
By using Log Analytics, Flow Analyzer enables you to execute queries on VPC Flow Logs and obtain additional information about the traffic flows. This includes a table that offers details about every data flow and a graphic that shows the largest data flows.
Components of a query
You must execute a query on VPC Flow Logs in order to examine and comprehend your traffic flows. In order to view and track your traffic flows, Flow Analyzer assists you in creating the query, adjusting the display settings, and drilling down.
Traffic Aggregation
You must choose an aggregation strategy to filter the flows between the resources in order to examine VPC traffic flows. The following is how Flow Analyzer arranges the flow logs for aggregation:
Source and destination: this option makes use of the VPC Flow Logs’ SRC and DEST data. The traffic is aggregated from source to destination in this view.
Client and server: this setting looks for the person who started the connection. The server is a resource that has a lower port number. Because services don’t make requests, it also views the resources with the gke_service specification as servers. Both directions of traffic are combined in this shot.
Time-range selector
The time-range picker allows you to center the time range on a certain timestamp, choose from preset time options, or define a custom start and finish time. By default, the time range is one hour. For instance, choose Last 1 week from the time-range selector if you wish to display the data for the previous week.
Additionally, you can use the time-range slider to set your preferred time zone.
Basic filters
By arranging the flows in both directions based on the resources, you may construct the question.
Choose the fields from the list and enter values for them to use the filters.
Filter flows that match the chosen key-value combinations can have more than one filter expression added to them. An OR operator is used if you choose numerous filters for the same field. An AND operator is used when selecting filters for distinct fields.
For instance, the following filter logic is applied to the query if you choose two IP address values (1.2.3.4 and 10.20.10.30) and two country values (US and France):
(Country=US OR Country=France) AND (IP=1.2.3.4 OR IP=10.20.10.30)
The outcomes may differ if you attempt to alter the traffic choices or endpoint filters. To see the revised results, you have to execute the query one more.
SQL filters
SQL filters can be used to create sophisticated queries. You can carry out operations like the following by using sophisticated queries:
Comparing the values of the fields
Using AND/OR and layered OR operations to construct intricate boolean logic
Utilizing BigQuery capabilities to carry out intricate operations on IP addresses
BigQuery SQL syntax is used in the SQL filter queries.
Query result
The following elements are included in the query results:
The highest data flows chart shows the remaining traffic as well as the top five largest traffic flows throughout time. This graphic can be used to identify trends, such as increases in traffic.
The top traffic flows up to 10,000 rows averaged during the chosen period are displayed in the All Data Flows table. The fields chosen to organize the flows while defining the query’s filters are shown in this table.
Read more on Govindhtech.com
#FlowAnalyzer#SQL#BigQuery#virtualmachine#GoogleKubernetesEngine#SQLsyntax#News#Technews#Technology#Technologynwes#Technologytrends#govindhtech
0 notes
Text
Performance Optimization on OpenShift
Optimizing the performance of applications running on OpenShift involves several best practices and tools. Here's a detailed guide:
1. Resource Allocation and Management
a. Proper Sizing of Pods and Containers:
- Requests and Limits:Set appropriate CPU and memory requests and limits to ensure fair resource allocation and avoid overcommitting resources.
- Requests: Guaranteed resources for a pod.
- Limits:Maximum resources a pod can use.
- Vertical Pod Autoscaler (VPA):Automatically adjusts the CPU and memory requests and limits for containers based on usage.
b. Resource Quotas and Limits:
- Use resource quotas to limit the resource usage per namespace to prevent any single application from monopolizing cluster resources.
c. Node Selector and Taints/Tolerations:
- Use node selectors and taints/tolerations to control pod placement on nodes with appropriate resources.
2. Scaling Strategies
a. Horizontal Pod Autoscaler (HPA):
- Automatically scales the number of pod replicas based on observed CPU/memory usage or custom metrics.
- Example Configuration:
```yaml
apiVersion: autoscaling/v1
kind: HorizontalPodAutoscaler
metadata:
name: my-app-hpa
spec:
scaleTargetRef:
apiVersion: apps/v1
kind: Deployment
name: my-app
minReplicas: 2
maxReplicas: 10
targetCPUUtilizationPercentage: 70
```
b. Cluster Autoscaler:
- Automatically adjusts the size of the OpenShift cluster by adding or removing nodes based on the workload requirements.
3. Application and Cluster Tuning
a. Optimize Application Code:
- Profile and optimize the application code to reduce resource consumption and improve performance.
- Use tools like JProfiler, VisualVM, or built-in profiling tools in your IDE.
b. Database Optimization:
- Optimize database queries and indexing.
- Use connection pooling and proper caching strategies.
c. Network Optimization:
- Use service meshes (like Istio) to manage and optimize service-to-service communication.
- Enable HTTP/2 or gRPC for efficient communication.
4. Monitoring and Analyzing Performance
a. Prometheus and Grafana:
- Use Prometheus for monitoring and alerting on various metrics.
- Visualize metrics in Grafana dashboards.
- Example Prometheus Configuration:
```yaml
apiVersion: monitoring.coreos.com/v1
kind: ServiceMonitor
metadata:
name: my-app
spec:
selector:
matchLabels:
app: my-app
endpoints:
- port: web
interval: 30s
```
b. OpenShift Monitoring Stack:
- Leverage OpenShift's built-in monitoring stack, including Prometheus, Grafana, and Alertmanager, to monitor cluster and application performance.
c. Logging with EFK/ELK Stack:
- Use Elasticsearch, Fluentd, and Kibana (EFK) or Elasticsearch, Logstash, and Kibana (ELK) stack for centralized logging and log analysis.
- Example Fluentd Configuration:
```yaml
apiVersion: v1
kind: ConfigMap
metadata:
name: fluentd-config
data:
fluent.conf: |
<source>
@type tail
path /var/log/containers/*.log
pos_file /var/log/fluentd-containers.log.pos
tag kubernetes.*
format json
time_format %Y-%m-%dT%H:%M:%S.%NZ
</source>
```
d. APM Tools (Application Performance Monitoring):
- Use tools like New Relic, Dynatrace, or Jaeger for distributed tracing and APM to monitor application performance and pinpoint bottlenecks.
5. Best Practices for OpenShift Performance Optimization
a. Regular Health Checks:
- Configure liveness and readiness probes to ensure pods are healthy and ready to serve traffic.
- Example Liveness Probe:
```yaml
livenessProbe:
httpGet:
path: /healthz
port: 8080
initialDelaySeconds: 30
periodSeconds: 10
```
b. Efficient Image Management:
- Use optimized and minimal base images to reduce container size and startup time.
- Regularly scan and update images to ensure they are secure and performant.
c. Persistent Storage Optimization:
- Use appropriate storage classes for different types of workloads (e.g., SSD for high I/O applications).
- Optimize database storage configurations and perform regular maintenance.
d. Network Policies:
- Implement network policies to control and secure traffic flow between pods, reducing unnecessary network overhead.
Conclusion
Optimizing performance on OpenShift involves a combination of proper resource management, scaling strategies, application tuning, and continuous monitoring. By implementing these best practices and utilizing the available tools, you can ensure that your applications run efficiently and effectively on the OpenShift platform.
For more details click www.hawkstack.com
#redhatcourses#information technology#linux#containerorchestration#docker#kubernetes#container#containersecurity#dockerswarm#aws
0 notes
Text
Kubernetes Labels and Selectors Tutorial for Beginners
Hi, a new #video on #kubernetes #labels and #selectors is published on #codeonedigest #youtube channel. Learn kubernetes #labelsandselectors #apiserver #kubectl #docker #proxyserver #programming #coding with #codeonedigest #kuberneteslabelsandselectors
Kubernetes Labels are key-value pairs which are attached to pods, replication controller and services. They are used as identifying attributes for objects such as pods and replication controller. They can be added to an object at creation time and can be added or modified at the run time. Kubernetes selectors allows us to select Kubernetes resources based on the value of labels and resource…

View On WordPress
#kubernetes explained#kubernetes installation#kubernetes interview questions#kubernetes label vs taint#kubernetes labels#kubernetes labels and selectors#kubernetes labels and selectors example#kubernetes labels and taints#kubernetes labels node as worker#kubernetes labels nodes#kubernetes labels vs annotations#kubernetes labels vs selectors#kubernetes operator#kubernetes orchestration tutorial#kubernetes selector annotation#kubernetes selector expression#kubernetes selector field#kubernetes selector node#kubernetes selector not equal#kubernetes selector vs label#kubernetes tutorial#kubernetes tutorial for beginners
0 notes
Text
Optimizing Resource Allocation in Kubernetes Deployment_ Efficiency and Cost Savings
Kubernetes has emerged as a leading container orchestration platform, providing a scalable and efficient way to deploy and manage applications. It offers numerous benefits, such as automated scaling, fault tolerance, and self-healing capabilities. To leverage these advantages effectively, optimizing resource allocation in Kubernetes deployment becomes crucial.
Understanding Kubernetes Service and Deployment:
Kubernetes Service is vital in networking and load balancing within a Kubernetes cluster. It provides a stable network endpoint to expose applications and enables communication between various components. On the other hand, Kubernetes Deployment is responsible for managing application instances and ensuring their availability. It defines the desired state of the application and manages scaling, rolling updates, and rollbacks.
Key Concepts and Components of Kubernetes Service and Deployment:
Service Discovery: Labels and selectors enable dynamic service discovery, allowing applications to communicate without hardcoded endpoints.
Load Balancing: Kubernetes Service distributes traffic across multiple instances, ensuring high availability and improved performance.
Replica Sets: Kubernetes Deployment manages application instances, scaling and replacing failed replicas for desired state maintenance.
Importance of Resource Allocation Optimization:
Efficient resource allocation in Kubernetes deployment offers key benefits:
Cost Savings: Optimal resource allocation avoids over-provisioning, reducing infrastructure costs.
Improved Performance: Proper allocation ensures optimal application performance and responsiveness, avoiding bottlenecks and contention.
Scalability: Optimized allocation enables efficient scaling based on demand, maximizing resource utilization during peak periods.
Strategies for Optimizing Resource Allocation in Kubernetes Deployment:
Right-sizing Resource Requests and Limits: Analyze application resource requirements and set appropriate requests and limits to ensure optimal utilization without wastage.
Horizontal Pod Autoscaling (HPA): Automatically adjusts the number of application instances based on CPU utilization, memory usage, or custom metrics.
Vertical Pod Autoscaling (VPA): Dynamically adjust container resource requests and limits based on actual resource usage, optimizing allocation.
Node Affinity and Anti-Affinity: Schedule pods on specific nodes or avoid co-locating competing pods.
Tools and Technologies for Resource Allocation Optimization:
Prometheus and Grafana: Monitoring tools like Prometheus and Grafana provide valuable insights into resource utilization, allowing you to identify and optimize resource allocation.
Kubernetes Resource Quotas: Resource quotas restrict the number of resources a namespace or a user can consume, preventing resource hogging and promoting fair allocation.
Best Practices for Resource Allocation Optimization:
Continuous Monitoring: Regularly monitor resource utilization and application performance to identify optimization opportunities and adjust resource allocation accordingly.
Testing Blue/Green and Canary Deployments: Use Kubernetes blue-green deployment or Kubernetes canary deployment strategies to validate application changes before fully rolling them out, ensuring efficient resource allocation during updates.
CI/CD Pipeline Integration: Incorporate resource allocation optimization as a part of your CI CD pipeline, ensuring consistent and efficient deployment practices.
Conclusion / Call to Action:
For your resource allocation optimization efforts, consider exploring Ozone. Ozone is an end-to-end DevOps platform specifically designed for Kubernetes deployments. With Ozone, you can gain deep insights into your application's resource utilization, identify areas for improvement, and automate resource allocation adjustments for optimal performance and cost savings.
0 notes
Text
Node Affinity, Node Selector, and Other Ways to Better Control Kubernetes Scheduling
http://i.securitythinkingcap.com/Sp9pHK
0 notes
Text
Fluent bit is an open source, light-weight log processing and forwarding service. Fluent bit allows to collect logs, events or metrics from different sources and process them. These data can then be delivered to different backends such as Elastic search, Splunk, Kafka, Data dog, InfluxDB or New Relic. Fluent bit is easy to setup and configure. It gives you full control of what data to collect, parsing the data to provide a structure to the data collected. It allows one to remove unwanted data, filter data and push to an output destination. Therefore, it provides an end to end solution for data collection. Some wonderful features of fluent bit are: High Performance It is super Lightweight and fast, requires less resource and memory It supports multiple data formats. The configuration file for Fluent Bit is very easy to understand and modify. Fluent Bit has built-in TLS/SSL support. Communication with the output destination is secured. Asynchronous I/O Fluent Bit is compatible with docker and kubernetes and can therefore be used to aggregate application logs. There are several ways to log in kubernetes. One way is the default stdout logs that are written to a host path”/var/log/containers” on the nodes in a cluster. This method requires a fluent bit DaemonSet to be deployed. A daemon sets deploys a fluent bit container on each node in the cluster. The second way of logging is the use of a persistent volume. This allows logs to be written and persistent in an internal or external storage such as Cephfs. Fluent bit can be setup as a deployment to read logs from a persistent Volume. In this Blog, we will look at how to send logs from a Kubernetes Persistent Volume to Elastic search using fluent bit. Once logs are sent to elastic search, we can use kibana to visualize and create dashboards using application logs and metrics. PREREQUISITES: First, we need to have a running Kubernetes Cluster. You can use our guides below to setup one if you do not have one yet: Install Kubernetes Cluster on Ubuntu with kubeadm Install Kubernetes Cluster on CentOS 7 with kubeadm Install Production Kubernetes Cluster with Rancher RKE Secondly, we will need an elastic search cluster setup. You can use elasticsearch installation guide if you don’t have one in place yet. In this tutorial, we will setup a sample elastic search environment using stateful sets deployed in the kubernetes environment. We will also need a kibana instance to help us visualize this logs. Deploy Elasticsearch Create the manifest file. This deployment assumes that we have a storage class cephfs in our cluster. A persistent volume will be created along side the elastic search stateful set. Modify this configuration as per your needs. $ vim elasticsearch-ss.yaml apiVersion: apps/v1 kind: StatefulSet metadata: name: es-cluster spec: serviceName: elasticsearch replicas: 1 selector: matchLabels: app: elasticsearch template: metadata: labels: app: elasticsearch spec: containers: - name: elasticsearch image: docker.elastic.co/elasticsearch/elasticsearch:7.2.0 resources: limits: cpu: 1000m requests: cpu: 100m ports: - containerPort: 9200 name: rest protocol: TCP - containerPort: 9300 name: inter-node protocol: TCP volumeMounts: - name: data mountPath: /usr/share/elasticsearch/data env: - name: cluster.name value: k8s-logs - name: node.name valueFrom: fieldRef: fieldPath: metadata.name - name: discovery.seed_hosts value: "es-cluster-0.elasticsearch" - name: cluster.initial_master_nodes value: "es-cluster-0" - name: ES_JAVA_OPTS value: "-Xms512m -Xmx512m"
initContainers: - name: fix-permissions image: busybox command: ["sh", "-c", "chown -R 1000:1000 /usr/share/elasticsearch/data"] securityContext: privileged: true volumeMounts: - name: data mountPath: /usr/share/elasticsearch/data - name: increase-vm-max-map image: busybox command: ["sysctl", "-w", "vm.max_map_count=262144"] securityContext: privileged: true - name: increase-fd-ulimit image: busybox command: ["sh", "-c", "ulimit -n 65536"] securityContext: privileged: true volumeClaimTemplates: - metadata: name: data labels: app: elasticsearch spec: accessModes: [ "ReadWriteOnce" ] storageClassName: cephfs resources: requests: storage: 5Gi Apply this configuration $ kubectl apply -f elasticsearch-ss.yaml 2. Create an elastic search service $ vim elasticsearch-svc.yaml kind: Service apiVersion: v1 metadata: name: elasticsearch labels: app: elasticsearch spec: selector: app: elasticsearch clusterIP: None ports: - port: 9200 name: rest - port: 9300 name: inter-node $ kubectl apply -f elasticsearch.svc 3. Deploy Kibana $ vim kibana.yaml --- apiVersion: apps/v1 kind: Deployment metadata: name: kibana labels: app: kibana spec: replicas: 1 selector: matchLabels: app: kibana template: metadata: labels: app: kibana spec: containers: - name: kibana image: docker.elastic.co/kibana/kibana:7.2.0 resources: limits: cpu: 1000m requests: cpu: 100m env: - name: ELASTICSEARCH_URL value: http://elasticsearch:9200 ports: - containerPort: 5601 --- apiVersion: v1 kind: Service metadata: name: kibana labels: app: kibana spec: ports: - port: 5601 selector: app: kibana Apply this configuration: $ kubectl apply -f kibana.yaml 4. We then need to configure and ingress route for the kibana service as follows: $ vim kibana-ingress.yaml apiVersion: extensions/v1beta1 kind: Ingress metadata: annotations: kubernetes.io/tls-acme: "true" ingress.kubernetes.io/force-ssl-redirect: "true" name: kibana spec: rules: - host: kibana.computingpost.com http: paths: - backend: serviceName: kibana servicePort: 5601 path: / tls: - hosts: - kibana.computingpost.com secretName: ingress-secret // This can be created prior if using custom certs $ kubectl apply -f kibana-ingress.yaml Kibana service should now be accessible via https://kibana.computingpost.com/ Once we have this setup, We can proceed to deploy fluent Bit. Step 1: Deploy Service Account, Role and Role Binding Create a deployment file with the following contents: $ vim fluent-bit-role.yaml --- apiVersion: v1 kind: ServiceAccount metadata: name: fluent-bit --- apiVersion: rbac.authorization.k8s.io/v1 kind: ClusterRole metadata: name: fluent-bit-read rules: - apiGroups: [""] resources: - namespaces - pods verbs: ["get", "list", "watch"] --- apiVersion: rbac.authorization.k8s.io/v1 kind: ClusterRoleBinding metadata: name: fluent-bit-read roleRef: apiGroup: rbac.authorization.k8s.io kind: ClusterRole name: fluent-bit-read subjects: - kind: ServiceAccount name: fluent-bit namespace: default Apply deployment config by running the command below. kubectl apply -f fluent-bit-role.yaml Step 2: Deploy a Fluent Bit configMap This config map allows us to be able to configure our fluent Bit service accordingly. Here, we define the log parsing and routing for Fluent Bit. Change this configuration to match your needs. $ vim fluentbit-configmap.yaml
apiVersion: v1 kind: ConfigMap metadata: labels: k8s-app: fluent-bit name: fluent-bit-config data: filter-kubernetes.conf: | [FILTER] Name kubernetes Match * Kube_URL https://kubernetes.default.svc:443 Kube_CA_File /var/run/secrets/kubernetes.io/serviceaccount/ca.crt Kube_Token_File /var/run/secrets/kubernetes.io/serviceaccount/token Kube_Tag_Prefix kube.var.log Merge_Log On Merge_Log_Key log_processed K8S-Logging.Parser On K8S-Logging.Exclude Off fluent-bit.conf: | [SERVICE] Flush 1 Log_Level info Daemon off Parsers_File parsers.conf HTTP_Server On HTTP_Listen 0.0.0.0 HTTP_Port 2020 @INCLUDE input-kubernetes.conf @INCLUDE filter-kubernetes.conf @INCLUDE output-elasticsearch.conf input-kubernetes.conf: | [INPUT] Name tail Tag * Path /var/log/*.log Parser json DB /var/log/flb_kube.db Mem_Buf_Limit 5MB Skip_Long_Lines On Refresh_Interval 10 output-elasticsearch.conf: | [OUTPUT] Name es Match * Host $FLUENT_ELASTICSEARCH_HOST Port $FLUENT_ELASTICSEARCH_PORT Logstash_Format On Replace_Dots On Retry_Limit False parsers.conf: | [PARSER] Name apache Format regex Regex ^(?[^ ]*) [^ ]* (?[^ ]*) \[(?[^\]]*)\] "(?\S+)(?: +(?[^\"]*?)(?: +\S*)?)?" (?[^ ]*) (?[^ ]*)(?: "(?[^\"]*)" "(?[^\"]*)")?$ Time_Key time Time_Format %d/%b/%Y:%H:%M:%S %z [PARSER] Name apache2 Format regex Regex ^(?[^ ]*) [^ ]* (?[^ ]*) \[(?[^\]]*)\] "(?\S+)(?: +(?[^ ]*) +\S*)?" (?[^ ]*) (?[^ ]*)(?: "(?[^\"]*)" "(?[^\"]*)")?$ Time_Key time Time_Format %d/%b/%Y:%H:%M:%S %z [PARSER] Name apache_error Format regex Regex ^\[[^ ]* (?[^\]]*)\] \[(?[^\]]*)\](?: \[pid (?[^\]]*)\])?( \[client (?[^\]]*)\])? (?.*)$ [PARSER] Name nginx Format regex Regex ^(?[^ ]*) (?[^ ]*) (?[^ ]*) \[(?[^\]]*)\] "(?\S+)(?: +(?[^\"]*?)(?: +\S*)?)?" (?[^ ]*) (?[^ ]*)(?: "(?[^\"]*)" "(?[^\"]*)")?$ Time_Key time Time_Format %d/%b/%Y:%H:%M:%S %z [PARSER] Name json Format json Time_Key time Time_Format %d/%b/%Y:%H:%M:%S %z [PARSER] Name docker Format json Time_Key time Time_Format %Y-%m-%d %H:%M:%S.%L Time_Keep On [PARSER] # http://rubular.com/r/tjUt3Awgg4 Name cri Format regex Regex ^(?[^ ]+) (?stdout|stderr) (?[^ ]*) (?.*)$ Time_Key time Time_Format %Y-%m-%dT%H:%M:%S.%L%z [PARSER] Name syslog Format regex Regex ^\(?[^ ]* 1,2[^ ]* [^ ]*) (?[^ ]*) (?[a-zA-Z0-9_\/\.\-]*)(?:\[(?[0-9]+)\])?(?:[^\:]*\:)? *(?.*)$ Time_Key time Time_Format %b %d %H:%M:%S kubectl apply -f fluentbit-configmap.yaml Step 3: Create a Persistent Volume Claim This is where we will write application logs. $ vim pvc.yaml apiVersion: v1 kind: PersistentVolumeClaim metadata: name: logs-pvc spec: accessModes: - ReadWriteMany storageClassName: cephfs #Change accordingly resources: requests: storage: 5Gi $ kubectl apply -f pvc.yaml Step 4: Deploy a kubernetes deployment using the config map in a file $ vim fluentbit-deployment.yaml apiVersion: apps/v1 kind: Deployment metadata: labels: k8s-app: fluent-bit-logging name: fluent-bit spec: replicas: 1 selector: matchLabels:
k8s-app: fluent-bit-logging template: metadata: annotations: prometheus.io/path: /api/v1/metrics/prometheus prometheus.io/port: "2020" prometheus.io/scrape: "true" labels: k8s-app: fluent-bit-logging kubernetes.io/cluster-service: "true" version: v1 spec: containers: - env: - name: FLUENT_ELASTICSEARCH_HOST value: elasticsearch - name: FLUENT_ELASTICSEARCH_PORT value: "9200" image: fluent/fluent-bit:1.5 imagePullPolicy: Always name: fluent-bit ports: - containerPort: 2020 protocol: TCP resources: terminationMessagePath: /dev/termination-log terminationMessagePolicy: File volumeMounts: - mountPath: /var/log name: varlog - mountPath: /fluent-bit/etc/ name: fluent-bit-config dnsPolicy: ClusterFirst restartPolicy: Always schedulerName: default-scheduler securityContext: serviceAccount: fluent-bit serviceAccountName: fluent-bit volumes: - name: varlog persistentVolumeClaim: claimName: logs-pvc - configMap: defaultMode: 420 name: fluent-bit-config name: fluent-bit-config Create objects by running the command below: $ kubectl apply -f fluentbit-deployment.yaml Step 5: Deploy an application Let’s test that our fluent bit service works as expected. We will use an test application that writes logs to our persistent volume. $ vim testpod.yaml apiVersion: v1 kind: Pod metadata: name: test-pod spec: containers: - name: app image: centos command: ["/bin/sh"] args: ["-c", "while true; do echo $(date -u) >> /var/log/app.log; sleep 5; done"] volumeMounts: - name: persistent-storage mountPath: /var/log volumes: - name: persistent-storage persistentVolumeClaim: claimName: logs-pvc Apply with the command: $ kubectl apply -f testpod.yaml Check if the pod is running. $ kubectl get pods You should see the following output: NAME READY STATUS RESTARTS AGE test-pod 1/1 Running 0 107s Once the pod is running, We can proceed to check if logs are sent to Elastic search. On Kibana, we will have to create an index as shown below. Click on “Management > Index Patterns> Create index pattern” Once the index has been created. Click on the discover icon to see if our logs are in place: See more guides on Kubernetes on our site.
0 notes
Text
Eventscripts effects

Module._compile (internal/modules/cjs/loader.js:1072:14)Īt Object.Module._extensions.js (internal/modules/cjs/loader.js:1101:10)Īt Module.load (internal/modules/cjs/loader.js:937:32)Īt Function.Module._load (internal/modules/cjs/loader.js:778:12)Īt Hook.eval (eval at create :365:1)Īt Hook.CALL_DELEGATE Compiler. Function.Module._resolveFilename (internal/modules/cjs/loader.js:889:15)Īt Function.Module._load (internal/modules/cjs/loader.js:745:27)Īt Module.require (internal/modules/cjs/loader.js:961:19)Īt require (internal/modules/cjs/helpers.js:92:18)Īt Object. An EventScripts library that provides new effects. wait until bundle finishedĩ% setup compilation DocGenPlugininternal/modules/cjs/loader.js:892Įrror: Cannot find module 'webpack/lib/util/makeSerializable.js' (node:2020) DeprecationWarning: -static-dir CLI flag is deprecated, see: Kube-system replicaset.apps/dashboard-metrics-scraper-58d4977855 1 1 1 21m Kube-system replicaset.apps/kubernetes-dashboard-59699458b 1 1 1 21m Kube-system replicaset.apps/metrics-server-85df567dd8 1 1 1 22m Kube-system replicaset.apps/calico-kube-controllers-f744bf684 1 1 1 23m Kube-system replicaset.apps/calico-kube-controllers-69d7f794d9 0 0 0 23m Kube-system deployment.apps/dashboard-metrics-scraper 1/1 1 1 22m Kube-system deployment.apps/kubernetes-dashboard 1/1 1 1 22m Kube-system deployment.apps/metrics-server 1/1 1 1 22m Kube-system deployment.apps/calico-kube-controllers 1/1 1 1 23m NAMESPACE NAME READY UP-TO-DATE AVAILABLE AGE Ingress daemonset.apps/nginx-ingress-microk8s-controller 1 1 1 1 1 22m Kube-system daemonset.apps/calico-node 1 1 1 1 1 kubernetes.io/os=linux 23m NAMESPACE NAME DESIRED CURRENT READY UP-TO-DATE AVAILABLE NODE SELECTOR AGE Kube-system service/dashboard-metrics-scraper ClusterIP 10.152.183.197 8000/TCP 22m Kube-system service/kubernetes-dashboard ClusterIP 10.152.183.103 443/TCP 22m Kube-system service/metrics-server ClusterIP 10.152.183.81 443/TCP 22m NAMESPACE NAME TYPE CLUSTER-IP EXTERNAL-IP PORT(S) AGEĭefault service/kubernetes ClusterIP 10.152.183.1 443/TCP 23m Ingress pod/nginx-ingress-microk8s-controller-qf5pm 1/1 Running 0 21m Kube-system pod/dashboard-metrics-scraper-58d4977855-94nsp 1/1 Running 0 21m Kube-system pod/kubernetes-dashboard-59699458b-pb5jb 1/1 Running 0 21m Kube-system pod/metrics-server-85df567dd8-jd6gj 1/1 Running 0 22m Kube-system pod/calico-kube-controllers-f744bf684-d77hv 1/1 Running 0 23m Kube-system pod/calico-node-2jltr 1/1 Running 0 23m
0 notes
Text
Using Daemonset with Kubernetes
Definition of Kubernetes Daemon set
Kubernetes makes sure that an application has ample resources, runs reliably, and maintains high availability throughout its lifecycle. The location of the app within the cluster is not a priority.
A DaemonSet is typically described using a YAML file. The fields in the YAML file give you added control of the Pod deployment process. A good example is utilizing labels to start specific Pods on a limited subset of nodes.
What is Kubernetes Daemon's set?
The Daemon set has normally defined with a YAML file and the additives within the YAML documents deliver the person additional management over the deployment method of the pod. Pods are the easy items deployed in Kubernetes which signifies the single instances of an executable manner in the cluster. Pod incorporates one or multiple packing containers which might be controlled as single resources.
A daemon set is a dynamic object in Kubernetes which is managed to utilize a controller. The user can set the favored country that represents the unique pods that want to exist on each node. The compromise in the manage loop can evaluate the cutting-edge sensible nation with the favored kingdom. If the sensible node, doesn’t fit the matching pod, then the controller of the daemon set creates a new one mechanically. This automatic technique has all lately created nodes and present nodes. The pods evolved utilizing the controller of the daemon set are not noted by the Kubernetes scheduler and gift because of the identical node itself.
Create a Daemon set
To create a Daemon set the following steps are involved.
The Daemon set is developed in a YAML file with a few parts.
It requires apiVersion
It requires the type or kind of the behavior for Daemon to set
It needs the metadata for the Daemon set
It needs spec_template for pod definition which the user needs to execute on all nodes.
It needs spec_selector to manage the pods for the Daemon set and this kind must be label specific in a template of pods. The selector name defined in the template is applied in the selector. But this name cannot be changed once the Daemon set is created without leaving the pods created before the Daemon set.
The spec_template-spec-node selector is used to execute only the nodes subset which suits the selector
Spec-template-spec-affinity is used to execute on nodes subset which has affinity match.
Once the configuration is completed, Daemon set is created in the cluster.
0 notes
Link
Node Selectors in Kubernetes

In a newly created Kubernetes cluster, as per default setup a pod can be scheduled on any of the worker node in the cluster. But there are some circumstances, where we may need to control which node the pod deploys to. via Pocket https://ift.tt/3A2ULWV January 15, 2022 at 10:23AM
0 notes
Text
Deployment of Web Application On Local Kubernetes Cluster by Integrating with AWS RDS using Terraform
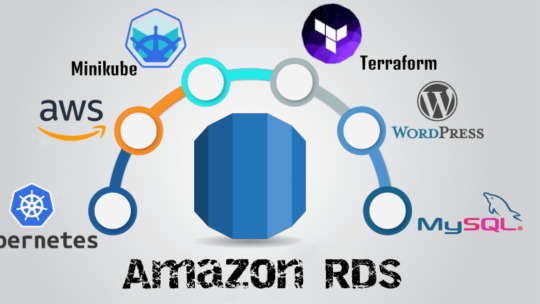
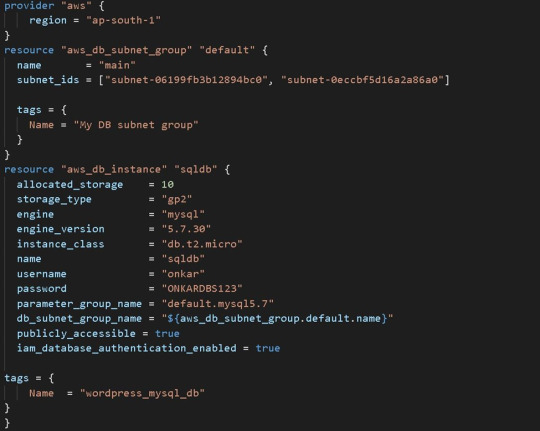
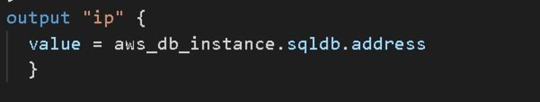
𝗛𝗲𝗹𝗹𝗼 Friends !! Welcome you all to my article on Deployment of Web Application On Local Kubernetes Cluster by Integrating with AWS RDS using Terraform. An overview of Kubernetes and AWS Service RDS With Terraform will also be present. Finally How can we utilize Terraform with AWS and Kubernetes for webserver deployment? We are also utilizing or building Terraform to create this application, as well as Deployment of Web Application on Kubernetes. Deployment of Web Application On Local Kubernetes Cluster by Integrating with AWS RDS using Terraform. DESCRIPTION OF THE TASK: - 🔷 Using Terraform, create an Infrastructure as Code that deploys the WordPress application automatically. - Use RDS for the relational database for the Wordpress application on AWS. - Install WordPress as a container on top of Minikube, EKS, or the AWS Fargate service. - If implemented on AWS, the WordPress application should be available via the public internet; if put on Minikube, it should be accessible through a workstation. - ⏩ In this work, we'll use terraform code to automate the deployment of a Web application utilizing Infrastructure As A Code, integrating the local kubernetes cluster with AWS RDS. COMPLETION OF THE TASK: 1) We need to develop Infrastructure As Code (IaC) using Terraform to deploy WordPress applications to a Kubernetes cluster automatically. In my situation, I use Minikube to run a local Kubernetes cluster as a workstation. So, let's get start writing Infrastructure As Code with Terraform for WordPress application deployment on Minikube Kubernetes Cluster.
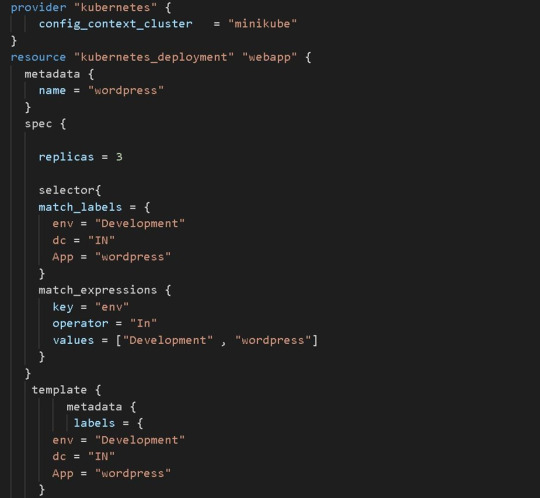
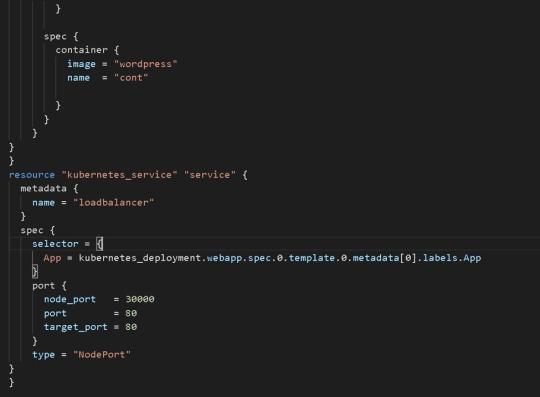
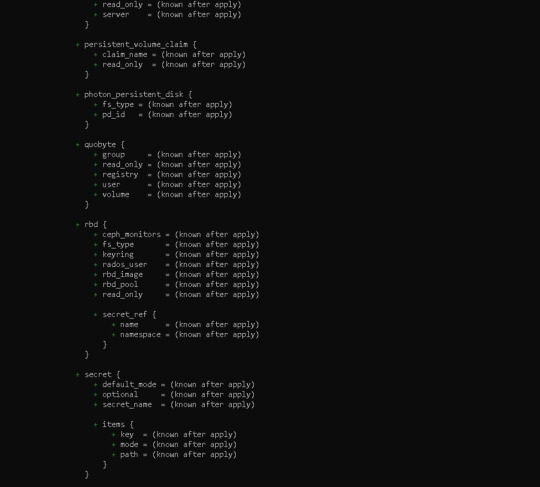
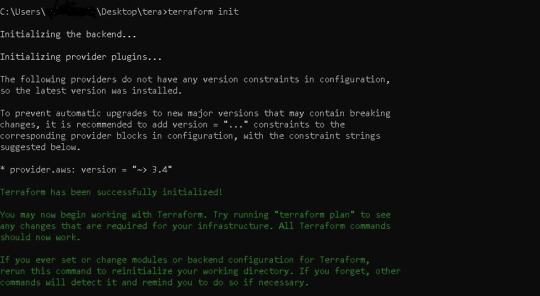
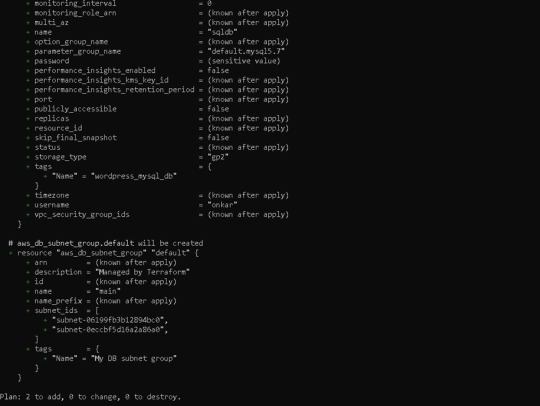
Finally The Replica Set field in the above terraform code defines a selector that indicates how to identify Pods it can acquire, a number of replicas indicating how many Pods it should maintain, and a pod template providing the data of new Pods it should produce to fulfil the number of replicas criterion. The objective of a ReplicaSet is then fulfill by producing and removing Pods as necessary to meet the specified number. The Pod template is use by a ReplicaSet to construct new Pods. To acquire the facility of a Load Balancer and to expose the deployment of a Web Application to public global access, use the Kubernetes service. Here, I'm using the Kubernetes service Node Port, which acts as a load balancer but isn't an external load balancer like AWS' Elastic Load Balancer. We can also utilise ELB to provide these services. 2) Next, we must execute the Terraform code. Before we can run the code, we must first initialise it and download the appropriate Terraform for Kubernetes plugins. terraform init
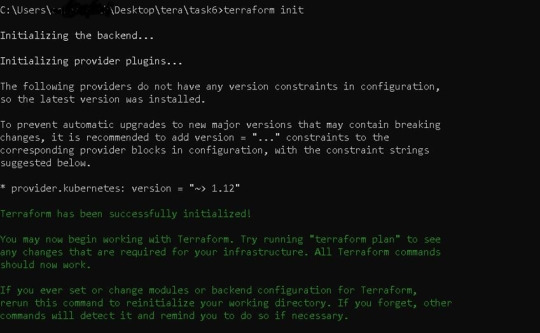
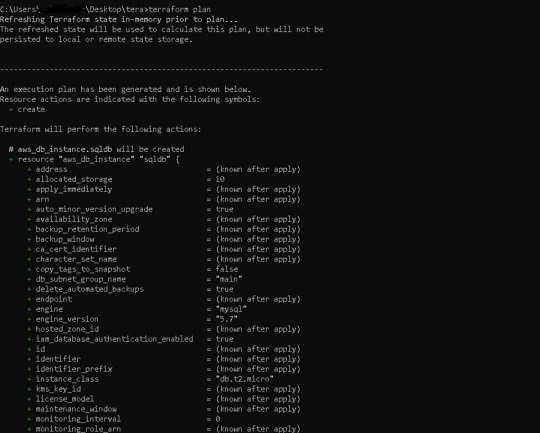
Before running our code, it's usually a good idea to understand the basic procedure. Because we need to inspect the terraform code plan initially, we'll use the command —> terraform plan
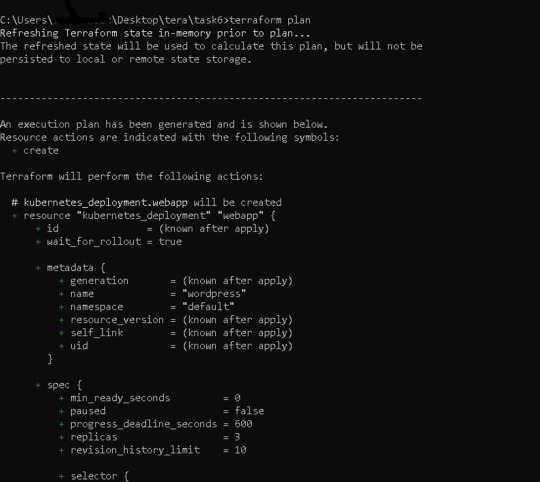
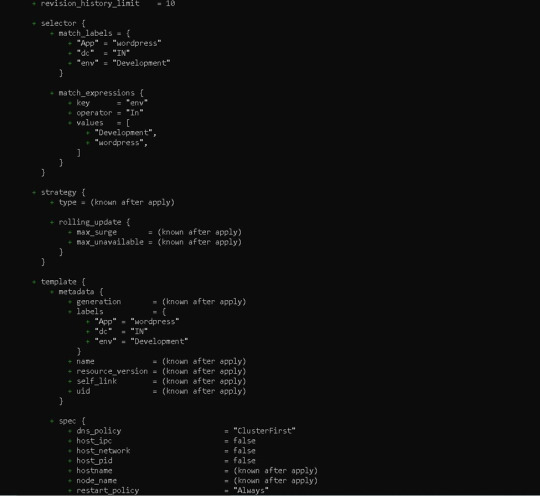
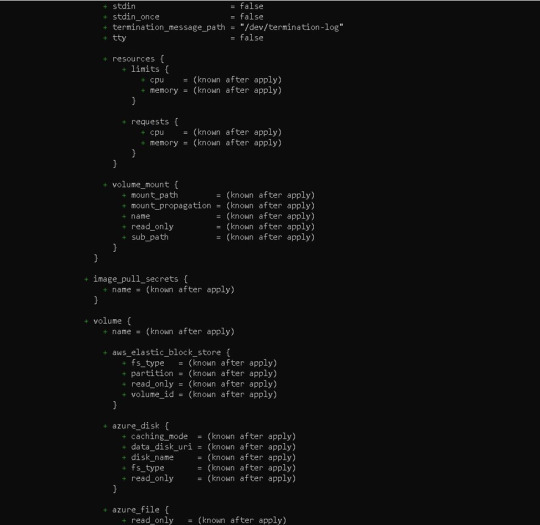
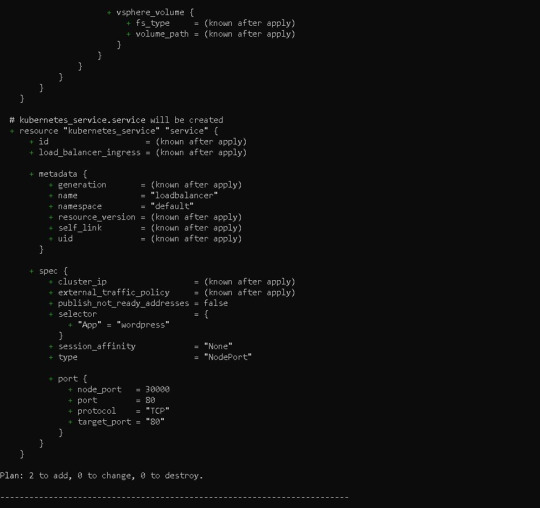
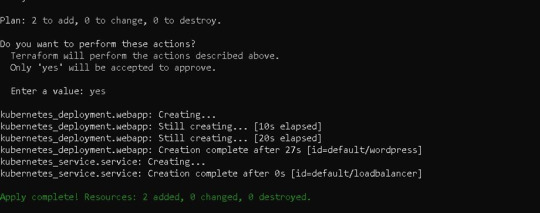
Following the terraform plan, we now run the terraform code, which creates Infrastructure As A Code with the command —> terraform apply
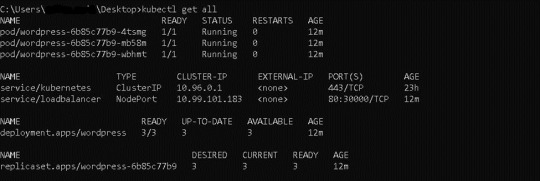
3) Now we can also see that the WordPress application has been deployed to a local Kubernetes cluster call Minikube. Using the command --> kubectl get all
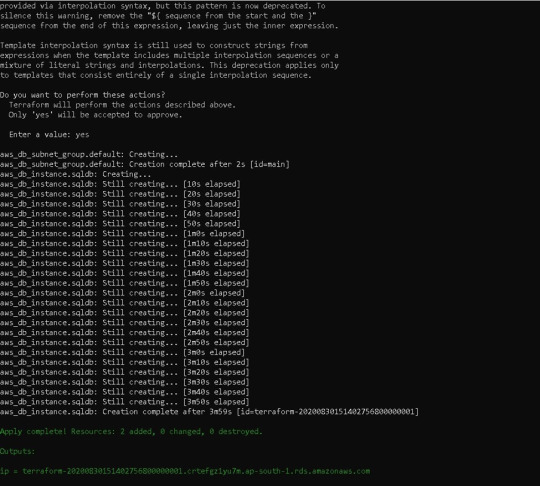
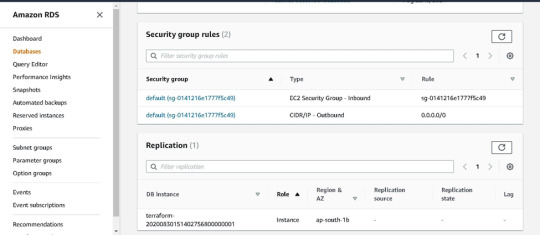
you can check if everything in your Kubernetes cluster is correctly deployed or not. 4) We also used Terraform to successfully install a WordPress application on Kubernetes. Now we also must construct a database-driven back end for WordPress. It is also always vital to maintain the database of any online application, which is why we utilize AWS Cloud's Relational Database Service as a Database As A Service (RDS). We also use Amazon Web Services' MySQL RDS for WordPress. Now we also must write more Terraform code for MySQL RDS, which will establish a single MySQL database using RDS. MySQL RDS Terraform code —>
5) For the RDS terraform code, we must once again initialise, plan, and apply the terraform code. We can see in AWS GUI Console one MySQL database is created in RDS --> terraform init
terraform planterraform apply
terraform apply
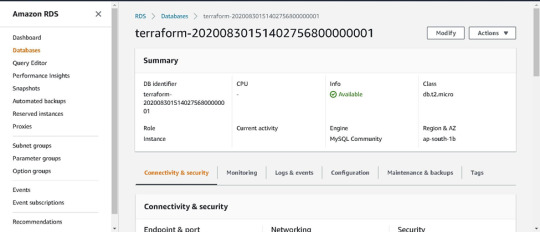
We can see in AWS GUI Console one MySQL database is create in RDS -->
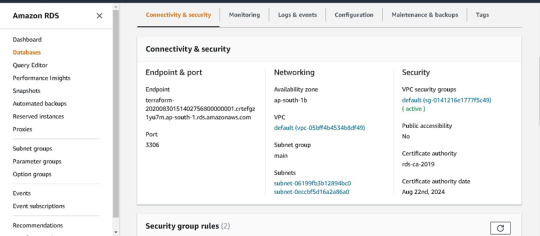
6) Finally, we can use the service URL supplied by the Kubernetes cluster's Node Port to run the WordPress application. Use the command to view the minikube service URL --> minikube service list
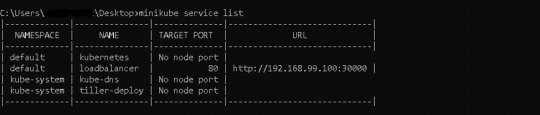
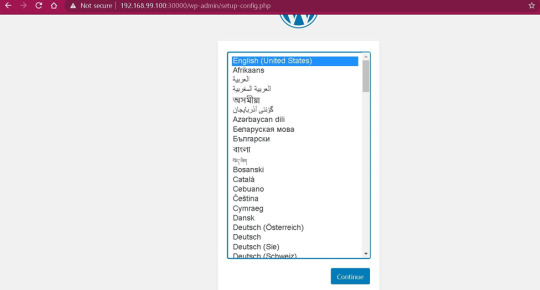
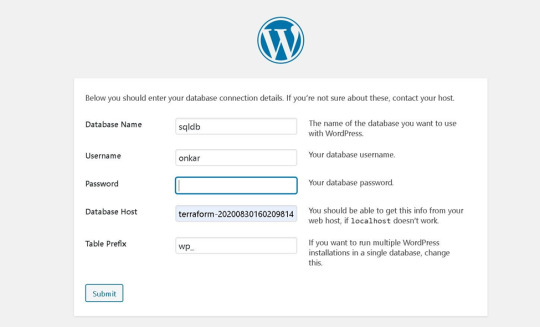
Enter the relevant details of the database we use for the back end as shown below to link MySQL database established by RDS to WordPress Application —>
Related Articles: Deployment of Web Application On Local Kubernetes Cluster by Integrating with AWS RDS using Terraform - https://coresumo.com/launching-a-webserver-amp-python-interpreter-on-docker-container/ - https://coresumo.com/automating-the-deployment-of-web-application-by-integrating-ansible-with-aws-cloud/ - https://coresumo.com/limiting-the-storage-in-hadoop-cluster-by-data-node/ - https://coresumo.com/deployment-of-haproxy-load-balancer-and-multiple-web-servers-on-aws-cloud-using-ansible/ - Benefits of Using Angular for Web Development 2021 - KALI Linux Not Prefer Software Development Ubuntu - How to Write Business Proposal for Client with Sample Format - Top 10 Best Coolest Movies Chris Hemsworth of all time - How to Increase Maximum upload file size WordPress 2 MB to TB or terabyte import unlimited - click here - PHP 8.0 vs PHP 7.4 and PHP 8.0 features performance benchmark install setup - Click here - WordPress Fill the form and PDF sent on Email using Contact Form 7 - Click here - How to fix hidden plugin editor on WordPress 2020 | I can’t find my plugin editor- Click here - GTmetrix VS Pingdom VS Google PageSpeed Insights VS Lighthouse Best performance optimization- Click here - How to install wordpres on local machine like window 10 linux and Mac - Click here - C vs C++ Difference Between C vs C++ vs Python vs Java - Who is the strongest character in Naruto - Top 10 Penny Stocks Invest 2021 Higher Return in 2025 2030 - What companies has Elon Musk owned - Top 15 Future technology predictions for 2025 2030 - 20 Ways to Increase Traffic to Your Website Blogs - Popular Standard Best JavaScript Libraries Deployment of Web Application On Local Kubernetes Cluster by Integrating with AWS RDS using Terraform Read the full article
0 notes
Text
Kubernetes
Kubectl cheat sheet
Get given context details:
# kubectl config get-contexts local CURRENT NAME CLUSTER AUTHINFO NAMESPACE * local local kube-admin-local
Set current context:
# kubectl config use-context local Switched to context "local".
Set default namespace for current context:
# kubectl config set-context --current --namespace=foo Context "local" modified. # kubectl config get-contexts local CURRENT NAME CLUSTER AUTHINFO NAMESPACE * local local kube-admin-local foo
List pods for a given deployment:
# kubectl describe deployments.apps <deployment-name> | grep ^Selector Selector: app=<app name> # kubectl get pods --selector app=<app name> NAME READY STATUS RESTARTS AGE <pod name> 1/1 Running 0 XXm
Get all pods running on specific k8s node:
# kubectl get pods --field-selector spec.nodeName=<node name> NAME READY STATUS RESTARTS AGE (...)
0 notes
Text
Kubernetes Replica Set Tutorial for Devops Beginners and Students
https://youtube.com/shorts/YACOITtBvUk Hi, a new #video on #kubernetes #replicaset is published on #codeonedigest #youtube channel. Learn #kubernetesreplicaset #node #docker #container #cloud #aws #azure #programming #coding with #codeonedigest @java
ReplicaSet is to maintain a stable set of replica Pods running at any given time. RS used to guarantee the availability of a specified number of identical Pods. Replica-Set is very much similar to replication controller. The key difference between the replica set and the replication controller is, the replication controller only supports equality-based selector whereas the replica set supports…

View On WordPress
0 notes
Text
Quản lý tài nguyên cho cluster Kubernetes
Đặt vấn đề
Một trong những thiếu sót khi sử dụng k8s trong môi trường production là không thiết đặt giới hạn tài nguyên cho hệ thống. Khi bạn không giới hạn tài nguyên cho các pod trong k8s, không sớm thì muộn sẽ có một thời điểm server của bạn sẽ hết sạch tài nguyên (điển hình là hết CPU và RAM). Việc này rất dễ xảy ra chạy các workload nặng trên nhiều node có cấu hình khác nhau. Cuối cùng server của bạn sẽ crash, hoặc là chạy rất chậm, khiến hệ thống trở nên kém ổn định, thậm chí là mất mát dữ liệu, gây tổn thất về uy tín và tiền bạc. Vậy một trong những việc đầu tiên khi một đưa bất kì thứ gì lên k8s là phải thiết đặt tài nguyên cho nó.
Ý tưởng về cấp phát và giới hạn tài nguyên
M��c định k8s chỉ có thể kiểm soát tài nguyên về CPU và RAM của hệ thống. Component chịu trách nhiệm kiểm soát tài nguyên và deploy pod lên các node được gọi là kube-scheduler. Có hai thuộc tính quan trọng để cấp phát và giới hạn tài nguyên được định nghĩa lúc bạn tạo workload:
Requests: Bảo đảm về lượng tài nguyên mà một pod trong workload sẽ được cấp. Mặc định các thuộc tính này sẽ để trống hoặc lấy theo yêu cầu mặc định của namespace (sẽ được đề cập sau). Tài nguyên request tối đa phải nhỏ hơn lượng tài nguyên mà một server mạnh nhất trong cluster có thể tải được.
Ví dụ: request: 100mCPU, 256MiB RAM mang ý nghĩa bạn sẽ luôn đảm bảo rằng k8s sẽ cấp cho bạn ít nhất 100 mCPU và 256MiB RAM. Hệ thống sẽ chỉ deploy pod của bạn trên node có đủ số lượng tài nguyên như trên. Tất nhiên kube-scheduler có đánh dấu lượng tài nguyên này đã bị chiếm dụng.
Giả sử bạn có 2 node, node 1 có 2 vCore và 8GiB RAM, node 2 có 4 vCore 16GiB RAM, nếu workload của bạn yêu cầu request: 2500mCPU, 8GiB RAM thì server sẽ chỉ deploy pod của workload này vào node 2.
Trong trường hợp cũng với cấu hình trên mà bạn yêu cầu tài nguyên request: 4000mCPU, 8GiB RAM, sẽ không có pod nào được deploy cả.
Limits: Giới hạn lượng tài nguyên mà một pod trong workload sẽ được sử dụng
Ví dụ: limits: 1000mCPU, 2GiB RAM mang ý nghĩa rằng bạn chỉ có thể dùng tối đa 1 CPU và 2GiB RAM.
Để thiết đặt chúng khi tạo một deployment, đây là YML ví dụ tạo deployment ubuntu:
apiVersion: apps/v1 kind: Deployment metadata: name: ubuntu-test labels: app: ubuntu spec: replicas: 1 selector: matchLabels: app: ubuntu template: metadata: labels: app: ubuntu spec: containers: - name: ubuntu image: ubuntu:bionic ports: - containerPort: 80 # chú ý mục resources này resources: limits: cpu: 1 memory: 2Gi requests: cpu: 500 memory: 2Gi
Bạn để ý ở mục spec.template.spec.containers[0].resource, sẽ thấy có hai setting là limits và requests. Đây chính là nơi thay đổi về lượng tài nguyên đảm bảo và giới hạn.
Qua 2 ví dụ trên, cần phải lưu ý hai điều sau:
k8s hoàn toàn có thể deploy pod của bạn vào một node mà lượng tài nguyên còn lại ít hơn lượng tài nguyên giới hạn. Ví dụ k8s sẽ có thể deploy workload request: 100 mCPU, 256MiB RAM, limits: 1000mCPU, 2GiB RAM vào một server chỉ còn trống 700 mCPU và 1 GiB RAM. Vậy nên nếu nếu workload của bạn yêu cầu nhiều tài nguyên hơn thì bạn cần chú ý cấp phát thêm tài nguyên cho chúng, vì trong trường hợp xấu, một pod dùng quá số lượng tài nguyên request mà node đã hết tài nguyên, node sẽ crash và buộc k8s phải kill một số pod khác hoặc tệ hơn là cả node đó sẽ không thể nào truy cập được nữa. Cơ chế kill pod đòi lại tài nguyên của k8s sẽ được đề cập ở mục dưới.
Kể cả khi bạn không dùng thì một pod cũng đã k8s đã tính pod của bạn đã chiếm dụng lượng tài nguyên bằng với lượng tài nguyên yêu cầu.
Tính chất tài nguyên CPU và RAM là khác nhau. Nếu pod của bạn vượt quá lượng tài nguyên CPU, k8s có thể "hãm" pod của bạn lại và không cho nó vượt quá giới hạn. Nhưng tài nguyên về bộ nhớ không thể bị giới hạn như vậy. Ngay khi pod của bạn vượt quá tài nguyên RAM cho phép, k8s sẽ kill luôn pod đó. Vậy nên cần chú ý về yêu cầu bộ nhớ của workload để tránh trường hợp pod bị kill ngoài ý muốn.
Việc deploy pod vào các node còn phải tùy việc server đó còn bao nhiêu tài nguyên (khá hiển nhiên nhưng vẫn phải đề cập). Giả sử một node có 4 vCore và 16GiB RAM nhưng đã bị nhiều pod chiếm dụng mất 3 vCore thì khi bạn request lượng tài nguyên request: 2500mCPU, 8GiB RAM thì pod của bạn cũng sẽ không bao giờ được deploy lên đó.
Cơ chế deploy và kill của kube-scheduler
Nếu bạn tạo một cluster k8s từ các công cụ như k3s, kubeadm hay từ các bên cung cấp nền tảng như AKS (của Azure), EKS (của Amazon) thì mặc định cluster đó sẽ sử dụng kube-scheduler để kiểm soát việc quản lý tài nguyên và deploy pod. Việc deploy hay kill pod của kube-scheduler đều hoạt động theo hai bước: Lọc và Chấm điểm.
Trường hợp k8s deploy một pod vào cluster:
Bước Lọc: kube-scheduler sẽ liệt kê tất cả các node thỏa mãn điều kiện tối thiểu của workload (tức thỏa mãn lượng tài nguyên request). Nếu trong danh sách đó không có node nào, pod của bạn sẽ không bao giờ được deploy. Các pod chưa được deploy vẫn sẽ có cơ hội được chạy do kube-scheduler sẽ thực hiện việc chấm điểm này liên tục.
Bước Chấm điểm: kube-scheduler sẽ đánh giá các node thông qua nhiều tiêu chí khác nhau, từ đó đưa ra điểm số của node đó. kube-scheduler sẽ deploy vào node có điểm số cao nhất. Nếu có nhiều hơn 1 node có cùng một điểm số, pod sẽ được deploy ngẫu nhiên vào một trong các node đó.
Còn trường hợp k8s cần kill pod để thu hồi lại tài nguyên:
Bước Lọc: kube-scheduler sẽ liệt kê tất cả các pod đang hoạt động trong node đang bị quá tải.
Bước Chấm điểm: kube-scheduler sẽ đánh giá các pod đó thông qua độ ưu tiên của pod (Pod Priority). Pod nào có điểm ưu tiên thấp hơn sẽ bị kill, các pod có điểm ưu tiên ngang nhau sẽ được kill ngẫu nhiên. Việc này sẽ lặp đi lặp lại đến khi server đủ tài nguyên thì thôi. Nhưng thông thường chúng ta thường bỏ quên mất tính năng này, nên các pod sẽ có điểm ưu tiên ngang nhau, vì vậy các pod sẽ bị chấm điểm thông qua lượng tài nguyên sử dụng. Các pod vượt quá tài nguyên yêu cầu càng nhiều, thì pod đó càng có khả năng bị kill. Việc này cũng sẽ lặp đi lặp lại đến khi server đủ tài nguyên thì thôi.
Trong trường hợp bạn có đặt mức độ ưu tiên cho pod, nếu bạn đặt cho pod của mình có độ ưu tiên cao hơn các pod hệ thống như kubelet, k8s có thể kill luôn các pod đó để thu hồi bộ nhớ. Tất nhiên việc này vừa có lợi điểm và hại điểm.
Điểm tốt: Node của bạn vẫn sẽ chạy và mọi thứ sẽ được deploy trở lại khi pod của bạn trả lại tài nguyên cho hệ thống.
Hại điểm: Khiến bạn lo lắng khi node được thông báo là đã crash và không có thông tin nào được cập nhật về. Tệ hơn nữa, node fail quá lâu sẽ khiến cho hệ thống bên thứ ba tưởng node của bạn đã sập (node tained), node sẽ bị xoá đi và thay thế bằng node mới, mất toàn bộ những gì mà node của bạn đang thực hiện (ví dụ như GKE autoscaler sẽ thay node đang sập bằng node mới sau một khoảng thời gian).
Việc Lọc và Chấm điểm sẽ được định đoạt bằng một trong hai quy cách: Thông qua các quy chế đã quy định (Policies) hoặc thông qua các profile quy chế (Profiles) nhưng trong phạm vi bài viết này, chúng ta sẽ không đề cập kĩ đến hai quy cách phức tạp trên mà sẽ xoáy vào cơ chế tài nguyên CPU và RAM.
Phân chia tài nguyên của cluster cho các namespace
Việc phân chia tài nguyên cho namespace (Resource Quota) được coi là TỐI QUAN TRỌNG đối với bất kì một người làm hệ thống nào. Thường một hệ thống sử dụng k8s sẽ không chỉ dành cho một mình DevOps hay SysAdmin sử dụng, mà sẽ được chia ra cho mỗi team (hiện tại đang trong một project) nắm một hoặc một vài namespace. Họ hoàn toàn có thể cung cấp quá ít tài nguyên cho workload để pod có thể hoạt động, hoặc đặt tài nguyên giới hạn quá cao khiến chúng chiếm hết tài nguyên hệ thống, vân vân. Tất cả đều sẽ dẫn đến một kết cục cuối cùng: sập server. Vậy nên với góc độ là người làm hệ thống, bạn cần phải phân chia tài nguyên của các namespace lại để đảm bảo server không bị quá tải. Khi họ vượt quá lượng tài nguyên yêu cầu, các pod nằm trong namespace sẽ bị kill nhưng sẽ không ảnh hưởng
Ý tưởng của việc phân chia tài nguyên cũng rất đơn giản như sau:
Mặc định các namespace sẽ không được định nghĩa gì về phân chia tài nguyên, các pod trong namespace sẽ thoải mái đặt ra bất kì yêu cầu tài nguyên nào mà mình muốn.
Khi thiết đặt phân chia tài nguyên, các pod trong namespace đó chỉ có thể yêu cầu hoặc giới hạn lượng tài nguyên nhỏ hơn hoặc bằng số lượng tài nguyên phân chia, tương tự như cấp phát và giới hạn tài nguyên của pod, cũng có các thông số như sau:
Request: Tổng lượng tài nguyên yêu cầu mà các pod có thể sử dụng khi deploy vào namespace. Vượt quá lượng tài nguyên trên pod sẽ không thể deploy
Ví dụ: Một namespace được cấp phát request: 4CPU, 8GiB RAM có ý nghĩa tổng tất cả lượng tài nguyên request của các pod phải nhỏ hơn hoặc bằng 4CPU và 8192MiB RAM. Ví dụ bạn có thể deploy 4 pod yêu cầu request: 1CPU, 2GiB RAM, 2 pod yêu cầu request: 2CPU, 4GiB RAM hoặc một pod yêu cầu request: 4CPU, 8GiB RAM
Limits: Tổng lượng tài nguyên giới hạn mà các pod có thể đạt được trong namespace. Các pod khi chạy mà tổng vượt quá giới hạn này, chúng sẽ bị kill theo cơ chế đã được nêu ra ở mục trên.
Qua đây chúng ta có thể đảm bảo rằng, khi một team chẳng may gây ra sự cố ở namespace của họ, tất cả hệ thống vẫn sẽ chạy bình thường chứ không hề gây ra sự cố hỏng hóc gì cho toàn hệ thống. Đặc biệt trong các cluster dev, việc này là quan trọng để tránh một team sẽ phá hỏng tiến độ làm việc cho các team khác. Việc thiết đặt cấp phát tài nguyên này cũng là một phương pháp để các team có thể ước lượng được lượng tài nguyên họ sẽ sử dụng rồi đưa những thông số này vào áp dùng lên product.
Kết thúc bài viết và các tài liệu tham khảo
Mong rằng thông qua bài viết này, mọi người có thể hiểu được cơ chế quản lý và deploy, kill pod của kube-scheduler, cũng như sự quan trọng của việc giới hạn và cấp phát tài nguyên trong hệ thống.
Các tài liệu tham khảo:
Setting Resource Requests and Limits in Kubernetes - https://www.youtube.com/watch?v=xjpHggHKm78
Kubernetes Scheduler - https://kubernetes.io/docs/concepts/scheduling-eviction/kube-scheduler/
Pod Priority and Preemption - https://kubernetes.io/docs/concepts/configuration/pod-priority-preemption/
Resource Quotas - https://kubernetes.io/docs/concepts/policy/resource-quotas/
0 notes
Text
Basic commands/operations in Kubernetes
Kubectl is a command-line interface that is used to run commands against the clusters of Kubernetes. It’s a CLI tool for the users through which you can communicate with the Kubernetes API server. Before running the command in the terminal, kubectl initially checks for the file name “config” and which you can see in the $HOME/.Kube directory. From a technical point of view, kubectl is a client for the Kubernetes API & from a user's point of view, it’s your cockpit to control the whole Kubernetes.
Kubectl syntax describes the command operations. To run the operations, kubectl includes the supported flags along with subcommands. And via this part of the Kubernetes series, we are going to render you some of the operations.
I. STARTING COMMANDS
1. Create
kubectl create −. kubectl create −. To run the operation we usually use the kubectl to create command. To do this, JSON or YAML formats are accepted.
$ kubectl create -f file_name.yaml
To specify the resources with one or more files: -f file1 -f file2 -f file...
Below is the list through which we use to create multiple things by using the kubectl command.
deployment namespace quota secret docker-registry secret secret generic secret tls serviceaccount service clusterip service loadbalancer service nodeport service nodeport
2. Get
Display one or many resources, This command is capable of fetching data on the cluster about the Kubernetes resources.
List all pods in the ps output format.
$ kubectl get pods
List all pods in ps output format with more information (such as node name).
$ kubectl get pods -o wide
List a single replication controller with specified NAME in the ps output format.
$ kubectl get replicationcontroller web
List deployments in JSON output format, in the "v1" version of the "apps" API group:
$ kubectl get deployments.v1.apps -o json
List a pod recognized by type and name specified in "pod.yaml" in the JSON output format.
$ kubectl get -f pod.yaml -o json
3. Run
Create and run a particular image, possibly replicated.
Creates a deployment or job to manage the created container(s).
Start a single instance of nginx.
$ kubectl run nginx --image=nginx
4. Expose
Expose a resource as a new Kubernetes service.
$ kubectl expose rc nginx --port=80 --target-port=8000
5. Delete
kubectl delete − Delete resources by filenames, stdin, resources and names, or by resources and label selector.
$ kubectl delete –f file_name/type_name --all
Delete all pods
$ kubectl delete pods --all
Delete pods and services with label name=myLabel.
$ kubectl delete pods,services -l name=myLabel
Delete a pod with minimal delay
II. APPLY MANAGEMENT
1. Apply
kubectl apply − It holds the capability to configure a resource by file or stdin.
$ kubectl apply –f filename
2. Annotate
kubectl annotate − To attach metadata to Kubernetes objects, you can use either labels or annotations. As labels can be mostly used to opt the objects and to find collections of objects that satisfy certain conditions.
$ kubectl annotate created_object -f file_name resource-version _key = value $ kubectl get pods pod_name --output=yaml
3. Autoscale
kubectl autoscale − Autoscale is employed to auto-scale the pods which are specified as Deployment, replica set, Replication Controller. It also creates an autoscaler that automatically selects and sets the number of pods that runs in the Kubernetes cluster.
$ autoscale -f file_name/type [--min=MINPODS] --max=MAXPODS [--cpu-percent=CPU] $ kubectl autoscale deployment foo --min=2 --max=10
4. Convert
Convert 'pod.yaml' to the most advanced version and print to stdout.
The command takes filename, directory, or URL as an input, and transforms it into the format of the version defined by --output-version flag. If the target version is not specified or not supported, convert to the latest version.
$ kubectl convert -f pod.yaml
5. kubectl edit − It is applied to end the resources on the server. This allows us to directly edit a resource that one can receive via the command-line tool.
$ kubectl edit Resource/Name | File Name
6. Replace
Replace a resource by filename or stdin.
JSON and YAML formats are accepted. If replacing an existing resource, the complete resource spec must be provided. This can be obtained by
$ kubectl replace -f file_name
7. Rollout
kubectl rollout − It is more competent in managing the rollout of deployment.
$ Kubectl rollout Sub_Command $ kubectl rollout undo deployment/tomcat
Apart from the above, we can perform multiple tasks using the rollout such as
rollout history
View the rollout history of a deployment
$ kubectl rollout history deployment/abc
rollout pause
the provided resource as paused
$ kubectl rollout pause deployment/nginx
To resume a paused resource.
$ kubectl rollout resume
rollout resume
Resume a paused resource
$ kubectl rollout resume deployment/nginx
rollout status
Watch the rollout status of a deployment
$ kubectl rollout status deployment/nginx
rollout undo
Rollback to the previous deployment
$ kubectl rollout undo deployment/abc
8. Scale
kubectl scale − It will scale the dimension of Kubernetes Deployments, ReplicaSet, Replication Controller, or job.
$ kubectl scale –replica = 3 FILE_NAME
III. WORK WITH APPS
1. cp
kubectl cp− Copy files and directories to and from containers.
$ kubectl cp Files_from_source Files_to_Destination $ kubectl cp /tmp/foo -pod:/tmp/bar -c specific-container
2. Describe
kubectl describe − Describes any appropriate resources in Kubernetes. Confers the details of a resource or an assortment of resources.
$ kubectl describe type type_name
Describe a pod
$ kubectl describe pod/nginx
Describe a pod identified by type and name in "pod.json"
$ kubectl describe -f pod.json
Describe all pods
$ kubectl describe pods
Describe pods by label name=label_name
$ kubectl describe po -l name=label_name
3. exec
kubectl exec− This helps to execute a command in the container.
$ kubectl exec POD -c container --command args $ kubectl exec 123-5-456 date
4. logs
They are employed to get the logs of the container in a pod. Printing the logs can be defining the container name in the pod. If the POD has only one container there is no need to define its name.
$ kubectl logs container_name $ kubectl logs nginx
5. port-forward
Forward one or more local ports to a pod. They are accepted to forward one or more local port to pods.
Listen on ports 5000 and 6000 locally, forwarding data to/from ports 5000 and 6000 in the pod
$ kubectl port-forward pod/mypod 5000 6000 $ kubectl port-forward tomcat 3000 4000 $ kubectl port-forward deployment/mydeployment 5000 6000
6. Top
kubectl top node − It displays CPU/Memory/Storage usage. The prime or the foremost command enables you to see the resource use for the nodes.
$ kubectl top node node_name
pod
Display metrics for all pods in the default namespace
$ kubectl top pod
node
Display metrics for all nodes
$ kubectl top node
7. Attach
kubectl attach − Its major function is to attach things to the running container.
$ kubectl attach pod –c containers
IV. CLUSTER MANAGEMENT
1. API-versions
kubectl API-versions − Basically, it prints the supported versions of API on the cluster.
$ kubectl api-version
2. cluster-info
kubectl cluster-info − It represents the cluster Info.
Display addresses of the master and services with label kubernetes.io/cluster-service=true
Besides, debug and diagnose cluster problems, use 'kubectl cluster-info dump'.
$ kubectl cluster-info
Dumps
Dumps cluster-info out suitable for debugging and diagnosing cluster problems. By default, dumps everything to stdout. You can optionally specify a directory with --output-directory. If you specify a directory, the Kubernetes will build an assortment of files in that directory.
By default only dumps things in the 'Kube-system' namespace, but you can shift to a different namespace with the --namespaces flag or specify --all-namespaces to dump all namespaces.
$ kubectl cluster-info dump --output-directory = /path/to/cluster-state
3. Certificate
Modify certificate resources.
approve
Approve/Accept a certificate signing request.
$ kubectl approve -f file_name/type
deny
Deny a certificate signing request. This action represents a certificate signing controller to not to issue a certificate to the requestor.
$ kubectl deny -f file_name/type
4. Drain
kubectl drain − This is used to drain a node for preservation purposes. It makes the node for maintenance. This will mark the node as unavailable so that it should not be indicated with a new container that will be created.
$ kubectl drain node_name –force
V. KUBECTL SETTINGS AND USAGE
1. Api-resources
Print the supported API Resources
$ kubectl api-resources
Print the supported API Resources with more information
$ kubectl api-resources -o wide
2. config
current-context
kubectl config current-context − It displays the current context.
$ kubectl config current-context
delete-cluster
kubectl config delete-cluster − Deletes the specified cluster from kubeconfig.
$ kubectl config delete-cluster cluster_name
delete-context
kubectl config delete-context − Deletes a specified context from kubeconfig.
$ kubectl config delete-context cluster_name
get-clusters
kubectl config get-clusters − Displays cluster defined in the kubeconfig.
$ kubectl config get-cluster $ kubectl config get-cluster cluster_name
get-contexts
kubectl config get-contexts − Specifies one or many contexts. Displays one or many contexts from the kubeconfig file.
$ kubectl config get-context cluster_name
rename-context
Renames a context from the kubeconfig file.
CONTEXT_NAME is the context name that you wish to change.
NEW_NAME is the new name you wish to set.
$ kubectl config rename-context old_name new_name
set
Sets a specific value in a kubeconfig file
PROPERTY_NAME is a dot delimited name where each token implies either an attribute name or a map key. Map keys may not include dots.
PROPERTY_VALUE is the new value you wish to set. Binary fields such as 'certificate-authority-data' expect a base64 encoded string unless the --set-raw-bytes flag is used.
$ kubectl config set PROPERTY_NAME PROPERTY_VALUE
set-cluster
kubectl config set-cluster − Sets the cluster entry in Kubernetes.
Specifying a name that already exists will merge new fields on top of existing values for those fields.
$ kubectl config set-cluster --server=https://1.2.3.4 $ kubectl config set-cluster NAME [--server=server] [--certificate-authority=path/to/certificate/authority] [--insecure-skip-tls-verify=true]
set-context
kubectl config set-context − Sets a context entry in kubernetes entrypoint. Clarifies a name that already exists will merge new fields on top of existing values for those fields.
$ kubectl config set-context NAME [--cluster = cluster_nickname] [-- user = user_nickname] [--namespace = namespace] $ kubectl config set-context gce --user=cluster-admin
set-credentials
kubectl config set-credentials − Sets a user entry in kubeconfig.
Specifying a name that already exists will merge new fields on top of existing values.
Bearer token flags: --token=bearer_token
Basic auth flags: --username=basic_user --password=basic_password
$ kubectl config set-credentials cluster-admin --username = name -- password = your_password
unset
kubectl config unset − It unsets a specific component in kubectl. PROPERTY_NAME is a dot delimited name where each token represents either an attribute name or a map key. Map keys may not hold dots.
$ kubectl config unset PROPERTY_NAME PROPERTY_VALUE
use-context
kubectl config use-context − Sets the current context in kubectl file.
$ kubectl config use-context context_name
view
Display merged kubeconfig settings or a specified kubeconfig file.
You can use --output jsonpath={...} to extract specific values using a JSON path expression.
$ kubectl config view
3. explain
Get the documentation of the resource and its fields
$ kubectl explain pods
Get the documentation of a specific field of a resource
$ kubectl explain pods.spec.containers
4. options
Print flags inherited by all commands
$ kubectl options
5. version
Print the client and server versions for the current context
$ kubectl version
VI. DEPRECATED COMMANDS
1. Rolling
kubectl rolling-update − Operates a rolling update on a replication controller. Reinstates the specified replication controller with a new replication controller by updating a POD at a time.
$ kubectl rolling-update old_container_name new_container_name -- image = new_container_image| -f new_controller_spec $ kubectl rolling-update frontend-v1 –f freontend-v2.yaml
What’s Next
Kubectl syntax mentions the commands as we've explained in the foregoing section. Kubernetes is so profitable for the organizations' artistic team, for each of the project, clarifies deployments, scalability, resilience, it also permits us to consume any underlying infrastructure and you know what it proffers you much to work upon. So let's call it Supernetes from today. Good luck and stay in touch!
0 notes
Text
Tutorial: launch a web application on EKS
Goal: launch a web application on EKS that load balances traffic to three nginx web servers.
Notes:
Tumblr (or my theme) is converting double dash (”-” followed by “-”) to em dash (”–”). For some commands, you’ll need to replace the em dash with double dashes. (sorry.)
Though this creates a public/private subnet cluster, it will launch the worker nodes in the public network. For better security, the worker nodes should be launches in private subnets.
TOC
Prereqs
Preview Nginx image locally (optional)
Create cluster
Deploy Kubernetes Dashboard (optional)
Running Nginx
Clean up
Part 1: Prereqs
You'll need to install the AWS CLI, eksctl, and kubectl, as well as authenticate with your cluster.
Follow these prerequisite instructions, but stop once the tools are installed. (Don’t create a cluster.)
Optionally, if you want to complete part 2, you should also install Docker locally.
Part 2: Preview Nginx image locally (optional)
If you’d like a preview of what you will see once completing this tutorial, you can run the Nginx Docker container locally.
docker run --name some-nginx -p 8081:80 -d nginx
Once you do this, visit http://localhost:8081 in browser. You should see this:
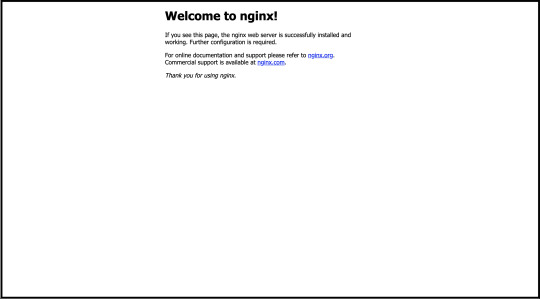
After validating, let’s stop the server and clean up resources:
docker stop some-nginx && docker rm some-nginx
Part 3: Create cluster
We’re going to create an cluster with 3 Linux managed nodes. (source):
eksctl create cluster \ --name nginx-webapp-cluster \ --version 1.18 \ --region us-west-2 \ --nodegroup-name linux-nodes \ --nodes 3 \ --with-oidc \ --managed
Let’s confirm successful creation by ensuring three are three nodes:
kubectl get nodes
Part 4: Deploy Kubernetes Dashboard (optional)
While not necessary for this tutorial, this will allow you to view details on your cluster, such as nodes, running pods, etc, and is recommended.
Instructions for running the Kubernetes Dashboard.
Part 5: Running Nginx
1. Create a namespace
kubectl create namespace nginx-webapp
2. Create a file, nginx-webapp-deployment.yaml:
apiVersion: apps/v1 kind: Deployment metadata: name: nginx-webapp namespace: nginx-webapp spec: replicas: 3 selector: matchLabels: app: nginx-webapp template: metadata: labels: app: nginx-webapp spec: containers: - name: nginx-webapp-container image: nginx ports: - name: http containerPort: 80d
3. Run:
kubectl apply -f nginx-webapp-deployment.yaml
4. Create a file, nginx-webapp-service.yaml:
apiVersion: v1 kind: Service metadata: name: nginx-webapp-service namespace: nginx-webapp labels: app: nginx-webapp spec: ports: - port: 80 targetPort: 80 selector: app: nginx-webapp type: LoadBalancer
5. Run:
kubectl apply -f nginx-webapp-service.yaml
6. Confirm three instances of Nginx is running:
kubectl get deployments --namespace=nginx-webapp
(wait for 3/3 ready)
7. Fetch load balancer IP:
kubectl get service --namespace=nginx-webapp
Visit the URL in the EXTERNAL-IP column. (Note: it may take a few minutes for the DNS to replicate, so try again if address not found.)
Part 6: Clean up
EKS is expensive, so make sure you clean up your resource when you are done:
eksctl delete cluster \ --region=us-west-2 \ --name=nginx-webapp-cluster
0 notes